Turn every recorded ride into rich, shareable data
Record your route and Motoavir builds a full Ride Summary β far beyond distance and time. Speed percentiles, elevation, estimated lean and cornering load, your route on the map, and ready-to-post ride cards.
A single "average speed" number hides everything that actually made the ride interesting
One traffic light or fuel stop drags your "average speed" down and tells you nothing about how you actually rode. You need the spread, not just the mean.
Was it a flat highway blast or a climb through the ghats? Without elevation, ascent, and descent, every ride looks the same on paper.
The part that makes a twisty road fun β how hard you leaned, left vs right β is exactly what generic trackers ignore.
A few bad satellite fixes can teleport your track and fake a 300 km/h "top speed." Raw data without quality control isn't trustworthy.
Flip on Record Route when you set off. When you finish, the Summary tab turns your GPS track into a complete picture of the ride β updating live while you're still moving.
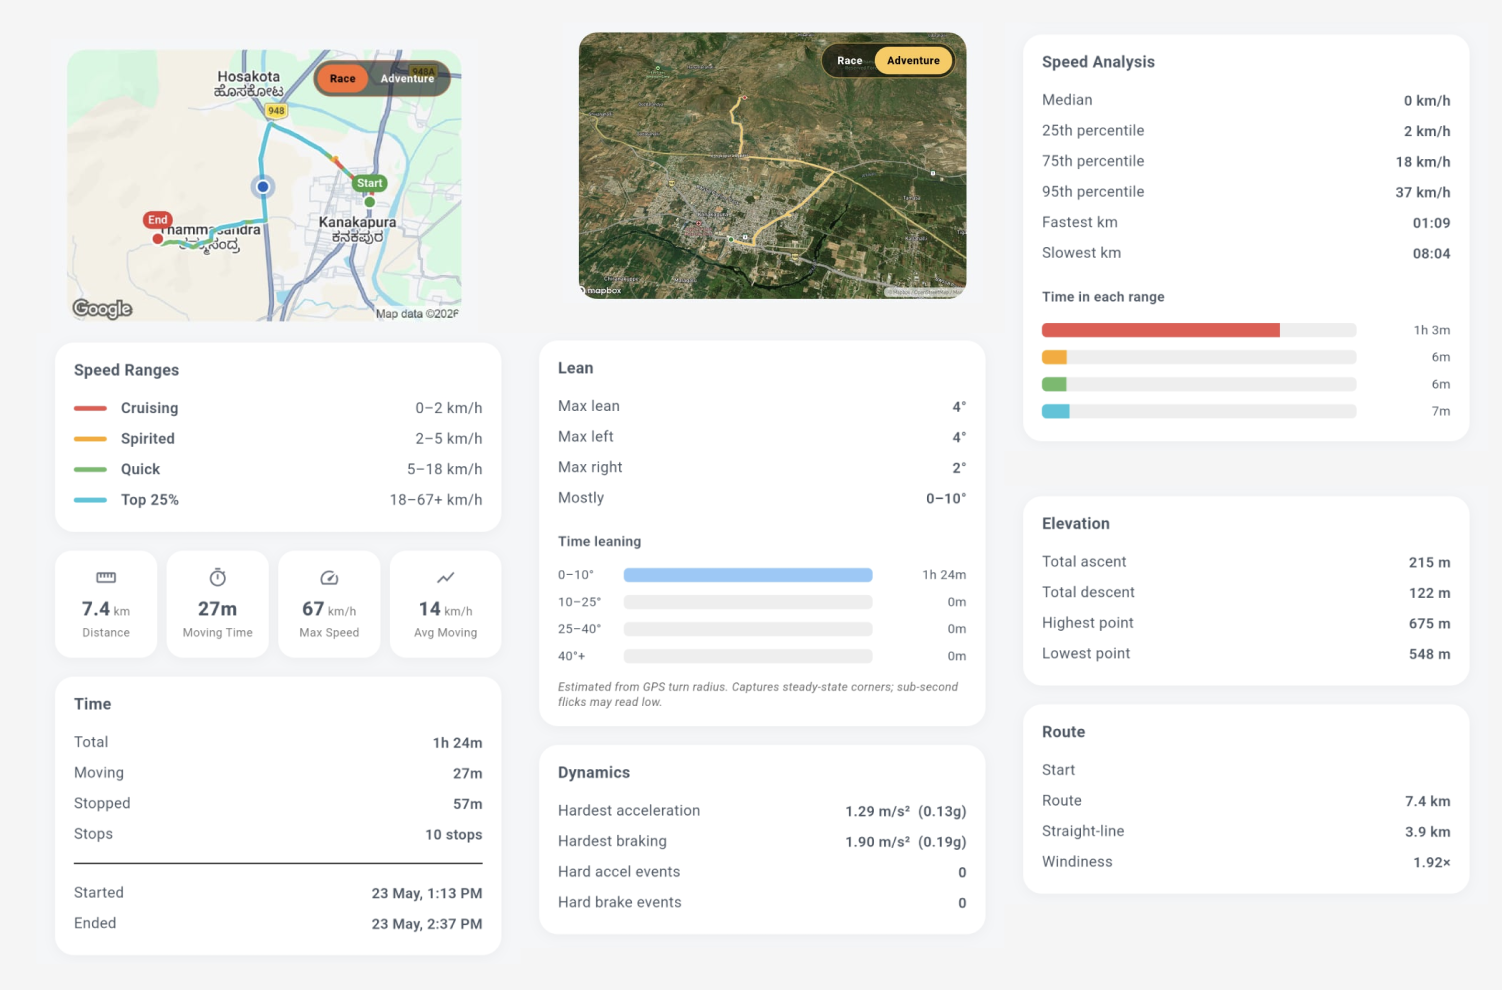
Headline numbers up top, then deeper breakdowns for time, speed, elevation, and lean. Everything respects your units β km/h or mph, km or miles β based on your preference.
Six groups of data, computed from your recorded route
See exactly how the ride broke down β total clock time versus time actually moving, plus when you set off and when you finished.
Go past the average with the full distribution β percentiles, your fastest and slowest split, and how much time you spent in each speed band.
Understand the terrain you covered β how much you climbed and dropped, and the high and low points of the route.
For bikes, see your estimated peak lean angle β left and right separately β and how long you spent leaned over. For cars, the same data is shown as lateral cornering g.
Your complete track drawn on the map, with speed shading so you can read the ride at a glance β where you flowed and where you slowed.
Export your ride as a polished card β an Adventure recap with a 3D map snapshot and your stats, a Race-style stat deck, or a head-to-head comparison with a friend.
No extra hardware β just your phone
Start a trip (or a Quick Ride) with route recording enabled. Motoavir captures your GPS track in the background while you ride.
Your distance and live max speed update as you go. A background service keeps recording even with the screen locked, and the app flags it if the OS interrupts tracking.
When you finish, the Summary tab lays out every metric β time, speed analysis, elevation, and lean β computed from your cleaned-up track.
Tap Share to generate an Adventure or Race card with your route and stats, or a head-to-head comparison β ready to post anywhere.
Speed and distance are gated on GPS accuracy, with a guard against teleport jumps β so your stats reflect the ride, not satellite noise.
Percentiles and time-in-range reveal whether you were cruising or pushing β far more honest than a single average.
Watch your estimated lean angles ride over ride, and spot whether you favour left or right corners.
Background tracking keeps logging with the screen off, monitors battery drain during a session, and warns you if the system pauses tracking.
Adventure, Race, and head-to-head cards turn your metrics into something worth posting β your ride, your bragging rights.
Lean angle for two wheels, lateral cornering g for four β the Summary adapts to whatever you ride or drive.
Download Motoavir and see every detail of how you ride